
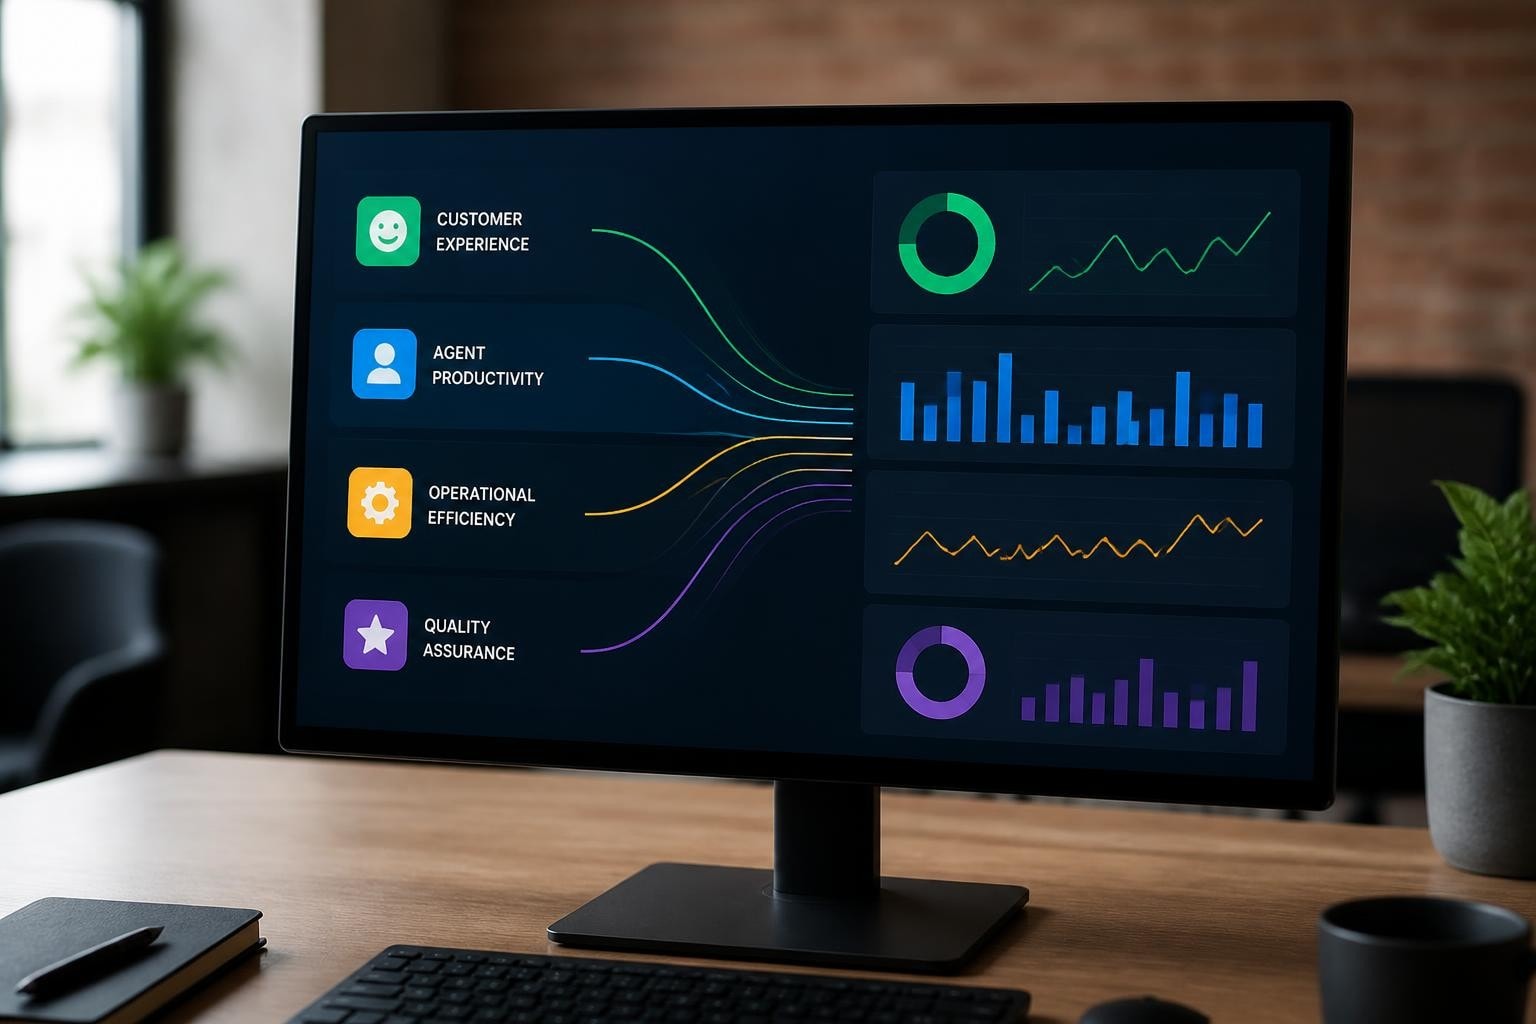
Contact Center Metrics: Essential KPIs to Track in 2026
Understanding and tracking the right contact center metrics separates high-performing operations from those struggling to meet customer expectations. In an era where customer experience directly impacts revenue and brand loyalty, businesses need clear visibility into how their contact centers perform across multiple dimensions. Whether managing an in-house team or partnering with outsourcing providers, the metrics you measure determine the improvements you can make. This guide examines the essential contact center metrics that matter in 2026, providing benchmark targets and practical strategies for optimization.
The Foundation of Contact Center Performance Measurement
Contact center metrics serve as the diagnostic tools that reveal operational health, customer satisfaction levels, and agent performance trends. Without consistent measurement, managers operate blind to inefficiencies, quality gaps, and opportunities for enhancement.
Modern contact centers track dozens of data points, but not all metrics carry equal weight. The challenge lies in selecting the right combination of indicators that align with business objectives while avoiding metric overload that paralyzes decision-making. Recent industry surveys show that most organizations measure core operational KPIs like abandonment rate and average handle time, yet many struggle to connect these metrics to business outcomes.
Customer Experience Metrics
Customer-focused contact center metrics measure how well the operation serves its primary purpose: delivering positive experiences that build loyalty and drive satisfaction. These indicators capture the customer's perspective and reveal whether service quality meets expectations.
Customer Satisfaction Score (CSAT) remains the most widely adopted customer experience metric. Typically measured through post-interaction surveys asking customers to rate their experience on a scale of 1-5 or 1-10, CSAT provides immediate feedback on individual interactions. Industry benchmarks place strong CSAT performance at 80% or higher, though current data shows significant variation across industries and contact types.
Net Promoter Score (NPS) measures customer loyalty by asking how likely customers are to recommend the company to others. This metric captures relationship strength beyond single interactions, providing insight into long-term customer sentiment.
First Contact Resolution (FCR) tracks the percentage of customer issues resolved during the initial interaction without requiring follow-up. High FCR correlates strongly with customer satisfaction while reducing operational costs. Organizations with effective inbound and outbound call strategies typically achieve FCR rates between 70-75%.

Key customer experience metrics include:
- Customer Effort Score (CES): Measures how easy customers find it to get their issues resolved
- Post-Call Survey Scores: Captures immediate feedback on specific interaction elements
- Customer Retention Rate: Tracks the percentage of customers who continue using services over time
- Complaint Resolution Time: Measures average duration from complaint submission to resolution
Operational Efficiency Indicators
Operational contact center metrics focus on process efficiency, resource utilization, and service level achievement. These indicators help managers optimize workflows, allocate staff appropriately, and maintain service standards.
Call Volume and Handling Metrics
Average Handle Time (AHT) measures the total time agents spend on customer interactions, including talk time, hold time, and after-call work. While shorter handle times can indicate efficiency, overly aggressive AHT targets may compromise quality. Industry benchmarks for 2026 suggest healthy AHT ranges vary significantly by industry, from 3-4 minutes for simple inquiries to 10+ minutes for complex technical support.
Average Speed of Answer (ASA) tracks how quickly agents answer incoming calls. Most organizations target ASA under 30 seconds, though customer expectations continue to tighten. The metric directly impacts customer satisfaction and abandonment rates.
Abandonment Rate measures the percentage of callers who hang up before reaching an agent. High abandonment often signals inadequate staffing, poor routing, or excessive wait times. Industry leaders maintain abandonment rates below 5%, though recent benchmarking data shows average rates climbing in understaffed centers.
| Metric | Target Range | Impact Area |
|---|---|---|
| Average Handle Time | 4-6 minutes (varies by industry) | Agent productivity, cost per contact |
| Average Speed of Answer | Under 20 seconds | Customer satisfaction, abandonment |
| Abandonment Rate | Below 5% | Revenue loss, customer frustration |
| Service Level (80/20) | 80% calls answered in 20 seconds | Customer experience, staffing efficiency |
| Occupancy Rate | 70-85% | Agent utilization, burnout risk |
Scheduling and Capacity Metrics
Effective contact center management requires precise forecasting and scheduling to match agent availability with contact volume patterns. Schedule Adherence measures how closely agents follow their assigned schedules, while Occupancy Rate tracks the percentage of time agents spend on customer-related activities versus idle time.
High occupancy rates (above 90%) may indicate understaffing and increase burnout risk. Conversely, occupancy below 70% suggests overstaffing and inefficient resource use. Finding the optimal balance requires continuous monitoring and adjustment based on volume patterns.
Service Level combines speed and accessibility metrics, typically expressed as "X% of calls answered within Y seconds." The industry-standard 80/20 target (80% of calls answered within 20 seconds) provides a balanced approach to responsiveness and resource efficiency.
Agent Performance and Quality Metrics
Agent-focused contact center metrics assess individual and team performance, identifying coaching opportunities and recognizing top performers. These indicators help maintain quality standards while supporting agent development.
Quality Assurance Measures
Quality Score evaluates agent performance against defined criteria through call monitoring and evaluation. Quality assessment typically examines communication skills, process adherence, problem-solving effectiveness, and compliance with protocols. Comprehensive metric frameworks suggest targeting quality scores above 90% while maintaining regular calibration sessions to ensure consistent evaluation standards.
Call Monitoring Coverage measures the percentage of agent interactions reviewed for quality. Most organizations review 3-5% of calls monthly, though high-risk or compliance-sensitive environments may require higher coverage rates.

Essential agent performance metrics include:
- Average Talk Time: Duration of active customer conversation
- After-Call Work Time: Post-interaction documentation and task completion duration
- Transfer Rate: Percentage of calls transferred to other agents or departments
- Calls Handled per Hour: Agent productivity measure
- Customer Callback Rate: Frequency of customers calling back about the same issue
Agent Satisfaction and Retention
Agent experience directly impacts customer experience, making employee-focused metrics increasingly important. Agent Attrition Rate tracks voluntary and involuntary turnover, with 2026 benchmarks showing industry averages around 30-40% annually. High turnover increases training costs, reduces service quality, and disrupts team dynamics.
Agent Satisfaction Score captures employee sentiment through regular surveys, while Training Completion Rates ensure agents maintain required skills and knowledge. Organizations investing in comprehensive call center job descriptions and clear performance expectations typically achieve better retention outcomes.
Financial and Business Impact Metrics
Business-focused contact center metrics connect operational performance to financial outcomes, demonstrating the contact center's contribution to organizational success.
Cost Efficiency Measures
Cost Per Contact calculates the total cost of handling each customer interaction, including labor, technology, facilities, and overhead. This metric enables comparison across channels (phone, email, chat) and helps identify optimization opportunities. Outsourcing to providers with global presence often reduces cost per contact through labor arbitrage while maintaining quality standards.
Revenue Per Call tracks the monetary value generated through contact center interactions, particularly relevant for sales-focused operations. This metric helps justify contact center investments and demonstrates return on investment.
Forecasting Accuracy measures how precisely predicted contact volumes match actual volumes. Accurate forecasting enables optimal staffing levels, reducing both wait times and idle agent time. Most high-performing centers achieve forecasting accuracy within 5-10% variance.
| Financial Metric | Purpose | Target |
|---|---|---|
| Cost Per Contact | Operational efficiency | Trending downward while maintaining quality |
| Revenue Per Call | Sales effectiveness | Aligned with product margins and conversion targets |
| Forecasting Accuracy | Resource planning | Within 5-10% of actual volumes |
| Shrinkage Rate | Productivity planning | 30-35% (including breaks, training, meetings) |
Implementing a Balanced Metrics Strategy
Selecting and tracking contact center metrics requires strategic thinking to avoid common pitfalls. Many organizations measure too many metrics without clear action plans, while others focus exclusively on efficiency metrics at the expense of quality and customer satisfaction.
Building Your Metric Hierarchy
Effective metric strategies distinguish between leading and lagging indicators. Leading indicators predict future performance and enable proactive intervention, while lagging indicators confirm outcomes after the fact. TSIA’s KPI framework recommends organizing metrics by role and responsibility, ensuring each team member focuses on indicators they can influence.
Start with 5-7 core metrics aligned with primary business objectives. For customer-focused organizations, prioritize CSAT, FCR, and service level. Cost-conscious operations may emphasize cost per contact, AHT, and occupancy rate. Sales-oriented centers typically track conversion rates, revenue per call, and quality scores.
Establishing Realistic Benchmarks
Generic industry benchmarks provide useful reference points, but each organization must establish targets aligned with its specific context, customer expectations, and business model. Productivity benchmarking resources emphasize comparing performance against past results and continuous improvement trajectories rather than fixating on external benchmarks that may not reflect comparable operating conditions.
Consider these factors when setting targets:
- Industry vertical: Customer expectations and interaction complexity vary significantly across industries
- Customer demographics: Different customer segments have distinct service preferences and patience levels
- Contact type: Technical support, sales, and general inquiries require different handling approaches
- Channel mix: Phone, email, chat, and social media each have unique performance characteristics
- Geographic location: Cultural factors and language considerations impact metrics
Technology's Role in Metrics Management
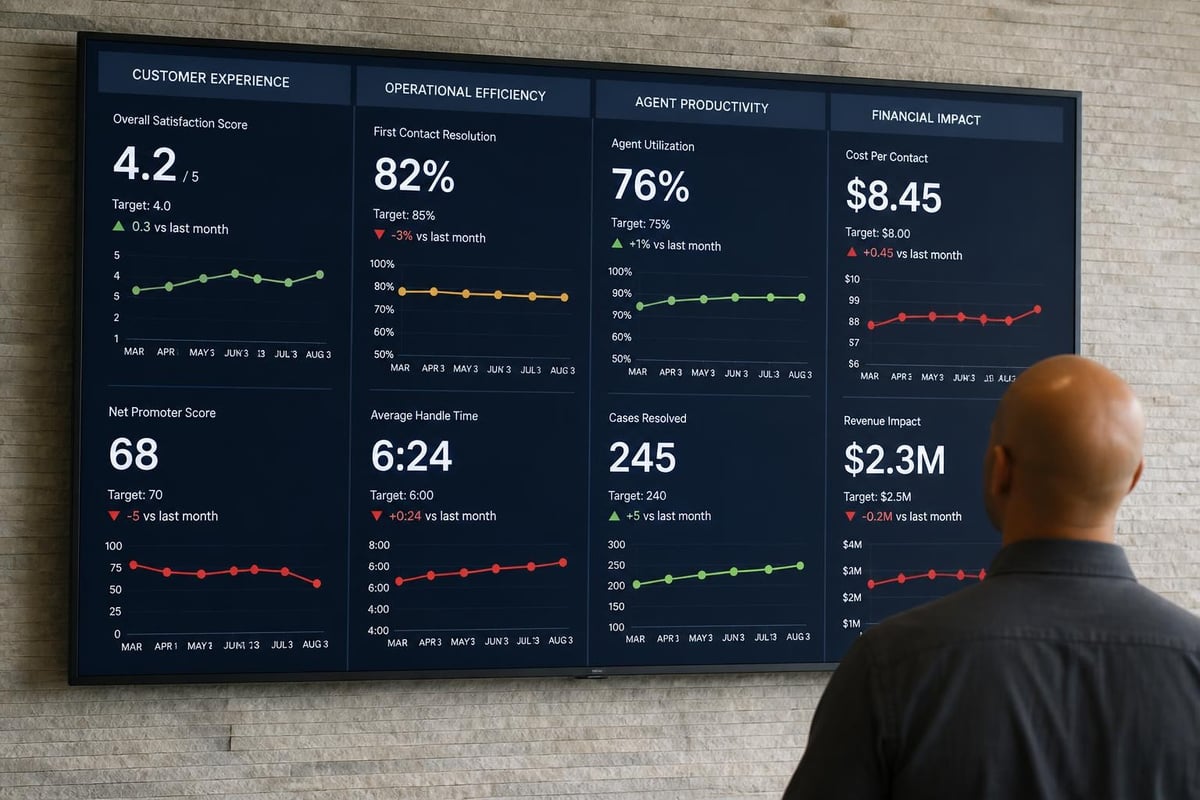
Modern contact center platforms provide sophisticated analytics capabilities that transform raw data into actionable insights. Real-time dashboards enable supervisors to monitor performance continuously and intervene promptly when metrics drift from targets.
AI-enabled workforce optimization tools analyze historical patterns to improve forecasting accuracy, optimize scheduling, and predict staffing needs. These systems integrate multiple data sources to provide comprehensive performance visibility and identify improvement opportunities that manual analysis might miss.
Speech analytics platforms automatically evaluate 100% of customer interactions, extracting insights about customer sentiment, agent performance, and common issues. This technology supplements traditional quality monitoring, enabling broader coverage and more consistent evaluation standards.
Integration across systems ensures metrics reflect complete customer journeys rather than isolated interactions. Connecting contact center data with CRM, sales, and financial systems provides context that explains metric trends and reveals cross-functional improvement opportunities.
Continuous Improvement Through Metrics
Contact center metrics achieve maximum value when integrated into continuous improvement processes. Regular performance reviews translate data into action plans, addressing root causes of underperformance rather than symptoms.
Creating Accountability and Alignment
Share relevant metrics with team members at all levels, ensuring everyone understands how their performance contributes to organizational success. Effective call center operations maintain transparency around performance expectations while providing the coaching and resources agents need to succeed.
Gamification strategies can make metrics engagement more interactive and motivating. Leaderboards, achievement badges, and performance challenges transform abstract numbers into tangible goals that drive healthy competition and recognition.
Adapting Metrics to Evolving Needs
Business priorities shift, customer expectations evolve, and new channels emerge. Periodically review your metrics strategy to ensure continued alignment with organizational objectives. Comprehensive guides covering multiple metrics suggest quarterly reviews of metric relevance and annual strategic reassessment of measurement frameworks.
Emerging trends like increased digital channel adoption, AI-assisted agents, and self-service expansion require corresponding metric adjustments. Track channel-specific performance indicators, monitor AI accuracy and effectiveness, and measure deflection rates to understand how automation impacts overall operations.
The most sophisticated contact center metrics programs balance efficiency, quality, and experience. They provide clear visibility into current performance while identifying opportunities for enhancement. By selecting the right combination of customer, operational, agent, and financial indicators, organizations create feedback loops that drive continuous improvement and competitive advantage.
Mastering contact center metrics enables data-driven decisions that enhance customer satisfaction, optimize costs, and improve agent performance across every dimension of your operation. As your business scales and customer expectations evolve, having the right measurement framework ensures you maintain service excellence while controlling expenses. Focus Services delivers scalable call center outsourcing solutions with built-in performance analytics and workforce optimization across our global delivery centers in the United States, El Salvador, the Philippines, and South Africa, helping you achieve your customer service objectives with measurable results.