

Customer Service Performance Metrics That Drive Results
Measuring the right customer service performance metrics separates exceptional support operations from mediocre ones. In 2026, businesses face increasing customer expectations while managing distributed teams across multiple time zones and channels. Understanding which metrics matter and how to leverage them strategically transforms raw data into actionable insights that improve customer satisfaction, reduce operational costs, and drive sustainable growth for call center operations.
Understanding Core Customer Service Performance Metrics
Customer service performance metrics provide quantifiable measurements of how effectively your support teams serve customers. These data points reveal operational strengths, identify improvement opportunities, and guide strategic decisions about staffing, training, and technology investments.
First Call Resolution (FCR) stands as one of the most critical indicators. This metric tracks the percentage of customer issues resolved during the initial contact without requiring follow-up interactions. Industry benchmarks suggest that strong FCR rates fall between 70-75%, though top-performing centers achieve rates above 80%.
When customers receive complete solutions immediately, satisfaction increases while operational costs decrease. Each resolved issue on the first contact eliminates the need for additional agent time, system resources, and customer effort.
Average Handle Time Considerations
Average Handle Time (AHT) measures the total duration of customer interactions, including talk time, hold time, and after-call work. While reducing AHT improves efficiency, this metric requires careful interpretation.
- Talk time: Active conversation between agent and customer
- Hold time: Periods when customers wait during the interaction
- After-call work: Documentation and follow-up tasks post-interaction
Balancing speed with quality remains essential. Pressuring agents to minimize AHT can compromise service quality and reduce first call resolution rates. The optimal approach treats AHT as one component within a broader performance framework rather than an isolated target.

Customer Satisfaction and Experience Metrics
Customer Satisfaction Score (CSAT) directly measures how customers perceive their service interactions. Typically collected through post-interaction surveys, CSAT asks customers to rate their experience on a defined scale.
Most organizations use a 1-5 scale, with the percentage of 4 and 5 ratings indicating satisfied customers. Strong CSAT scores generally exceed 85%, though benchmarks vary by industry and interaction complexity.
Net Promoter Score Applications
Net Promoter Score (NPS) gauges customer loyalty by asking one fundamental question: "How likely are you to recommend our company to a friend or colleague?" Responses fall into three categories:
| Category | Score Range | Description |
|---|---|---|
| Promoters | 9-10 | Loyal enthusiasts who fuel growth |
| Passives | 7-8 | Satisfied but unenthusiastic customers |
| Detractors | 0-6 | Unhappy customers who may damage brand reputation |
NPS calculation subtracts the percentage of detractors from the percentage of promoters. Positive scores indicate more promoters than detractors, with world-class companies achieving NPS above 50.
Customer Effort Score (CES) complements CSAT and NPS by measuring how much effort customers expend to resolve their issues. Research demonstrates that reducing customer effort correlates more strongly with loyalty than delighting customers, making CES particularly valuable for sales and customer service operations.
Operational Efficiency Metrics
Service Level Agreement (SLA) compliance measures whether teams answer calls within predetermined timeframes. The industry standard 80/20 rule targets answering 80% of calls within 20 seconds, though specific thresholds should align with business objectives and customer expectations.
Consistent SLA achievement requires accurate forecasting, appropriate staffing levels, and effective schedule adherence. When service levels drop below targets, customer frustration increases along with abandonment rates.
Abandonment Rate Analysis
Abandonment rate tracks the percentage of customers who disconnect before reaching an agent. High abandonment rates signal inadequate capacity, excessive wait times, or poorly designed call routing systems.
Calculate abandonment rate using this formula:
Abandonment Rate = (Abandoned Calls ÷ Total Incoming Calls) × 100
Industry benchmarks suggest maintaining abandonment rates below 5-8%. Rates exceeding these thresholds indicate serious capacity or efficiency problems requiring immediate attention.
Average Speed of Answer (ASA) complements service level metrics by measuring the average time customers wait before agent connection. Lower ASA values correlate with higher customer satisfaction and reduced abandonment, making this metric essential for capacity planning.
Agent Performance and Productivity Metrics
Occupancy rate measures the percentage of logged-in time agents spend actively handling customer interactions versus waiting for the next contact. This customer service performance metric balances productivity with agent wellbeing.
Target occupancy rates typically range between 70-85%. Rates below 70% suggest overstaffing or inefficient scheduling, while rates above 85% increase agent burnout risk and reduce performance quality.
Schedule Adherence Tracking
Schedule adherence monitors how consistently agents follow their assigned schedules, including start times, breaks, and shift end times. Strong schedule adherence maintains adequate staffing levels throughout the day, ensuring service level targets remain achievable.
- Login punctuality: Starting shifts on time
- Break compliance: Taking scheduled breaks as planned
- Availability consistency: Remaining available during scheduled work periods
- Logout timing: Ending shifts at designated times
Target schedule adherence rates of 95% or higher demonstrate professional workforce management while allowing reasonable flexibility for unavoidable deviations.

Quality assurance scores evaluate interaction quality through systematic call monitoring and evaluation. QA programs assess agent performance across multiple dimensions including greeting professionalism, problem-solving effectiveness, policy compliance, and closing procedures.
Establishing clear evaluation criteria ensures consistency across different evaluators and provides agents with specific improvement guidance. Many organizations implement calibration sessions where multiple evaluators score identical interactions to maintain scoring consistency.
Financial Performance Metrics
Cost per contact quantifies the total expense of handling each customer interaction, encompassing agent compensation, technology costs, facilities overhead, and management resources. This fundamental customer service performance metric enables accurate budgeting and efficiency benchmarking.
Calculate cost per contact by dividing total operational costs by the number of contacts handled during the same period. Industry averages vary significantly based on interaction complexity, channel mix, and geographic location.
Revenue per Contact Opportunities
For organizations with sales-enabled support teams, revenue per contact measures the average revenue generated through customer interactions. This metric transforms support operations from pure cost centers into revenue-contributing business units.
Strategies for maximizing revenue per contact include:
- Identifying upsell and cross-sell opportunities during support interactions
- Training agents on product knowledge and sales techniques
- Implementing intelligent recommendation systems
- Tracking conversion rates and revenue attribution
- Balancing sales objectives with customer satisfaction
Cost per resolution extends beyond cost per contact by accounting for multi-touch interactions. When issues require multiple contacts to resolve, the true cost includes all related interactions, making this metric more accurate for measuring actual resolution efficiency.
Channel-Specific Performance Indicators
Multi-channel support environments require channel-specific customer service performance metrics alongside universal measurements. Each communication channel presents unique characteristics demanding tailored evaluation approaches.
Email response time measures the duration between customer message receipt and agent response. While phone interactions demand immediate attention, email allows more flexible response timeframes. Target email response times typically range from 4-24 hours depending on customer expectations and competitive standards.
| Channel | Key Metrics | Industry Benchmarks |
|---|---|---|
| Phone | AHT, FCR, ASA | AHT: 6-8 min, FCR: 70-75%, ASA: <20 sec |
| Response time, Resolution time | Response: <24 hrs, Resolution: <48 hrs | |
| Chat | Response time, Concurrent chats | Response: <60 sec, Concurrent: 2-3 chats |
| Social Media | Response time, Engagement rate | Response: <1 hr, Engagement: varies widely |
Chat metrics include average concurrent chats per agent, which measures multitasking capacity and efficiency. Unlike phone interactions limited to one conversation at a time, chat agents typically handle 2-3 simultaneous conversations effectively.
Social Media Engagement Metrics
Social media support requires monitoring response times, engagement rates, and sentiment analysis. Public visibility amplifies both exceptional service and failures, making rapid response times particularly critical.
Response time expectations for social media typically fall below one hour, with many customers expecting replies within minutes. Automated acknowledgment messages help manage expectations while agents prepare comprehensive responses.
Workforce Management and Forecasting Metrics
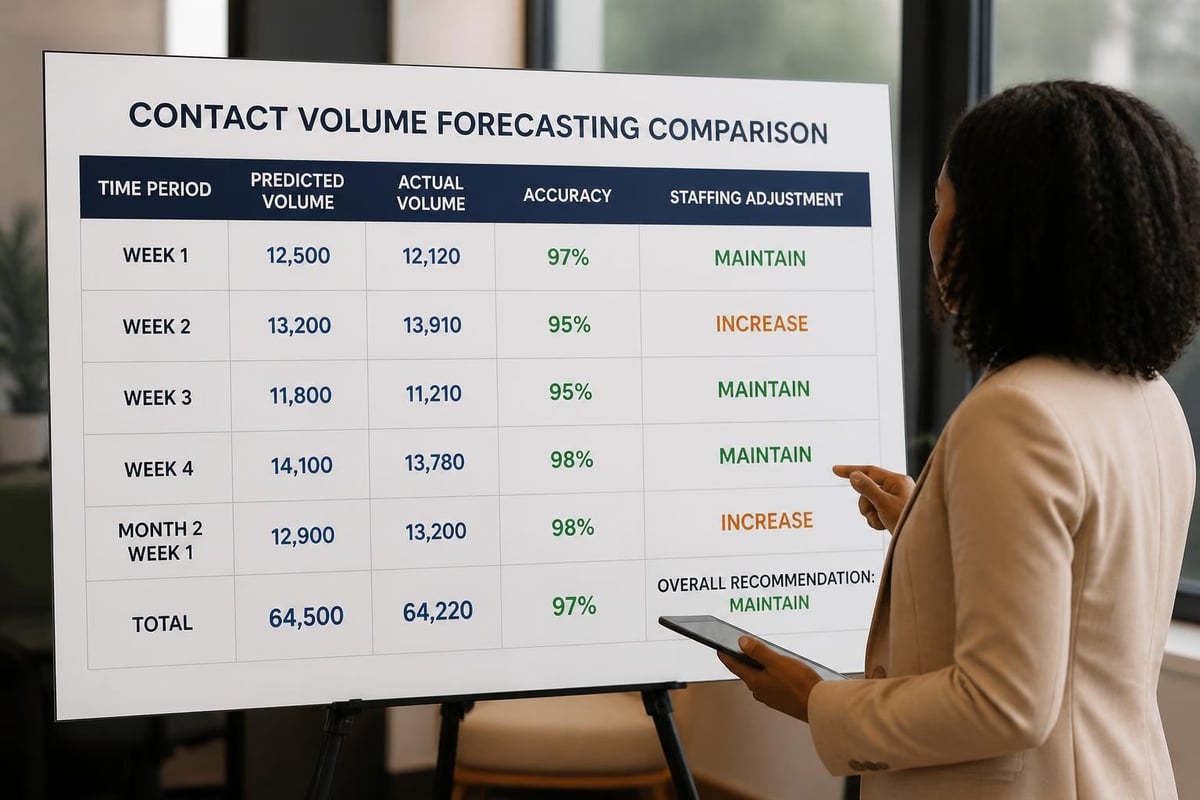
Forecast accuracy directly impacts service levels, cost efficiency, and agent experience. This metric compares predicted contact volumes against actual volumes, revealing planning process effectiveness.
Calculating forecast accuracy:
Forecast Accuracy = 100% – (|Forecasted Volume – Actual Volume| ÷ Actual Volume × 100)
Target forecast accuracy rates of 95% or higher within weekly timeframes, though daily and hourly forecasts naturally show greater variance. Consistent forecast accuracy enables confident staffing decisions that balance service quality with cost control.
Shrinkage accounts for all paid time when agents aren't available to handle customer contacts, including breaks, training, meetings, and system downtime. Understanding shrinkage enables accurate capacity planning when converting staffing requirements into actual headcount needs.
Total shrinkage typically ranges between 30-35% of paid time, though this varies based on organizational policies and operational requirements. Tracking shrinkage components separately identifies specific improvement opportunities.
Advanced Analytics and Predictive Metrics
Customer churn prediction uses historical patterns and interaction data to identify customers at risk of discontinuing service. Proactive intervention with at-risk customers prevents revenue loss while demonstrating commitment to customer success.
Machine learning algorithms analyze factors including contact frequency, sentiment trends, issue types, and resolution patterns to generate risk scores. High-risk customers receive priority attention through specialized retention programs.
Sentiment Analysis Applications
Sentiment analysis evaluates customer emotions during interactions through speech analytics, text analysis, and AI-powered natural language processing. Understanding emotional context provides deeper insights than traditional customer service performance metrics alone.
Sentiment trends reveal:
- Products or policies generating frustration
- Training needs based on negative sentiment patterns
- Agent coaching opportunities for difficult interactions
- Emerging issues before they escalate organization-wide
First contact resolution prediction models forecast which issues likely require multiple interactions, enabling proactive routing to experienced agents or specialized teams. This approach improves overall FCR rates while optimizing resource allocation.
Quality Assurance and Compliance Metrics
Compliance rate measures adherence to regulatory requirements, security protocols, and company policies during customer interactions. Industries with strict regulatory oversight including finance, healthcare, and telecommunications require particularly rigorous compliance monitoring.
Non-compliance incidents can result in substantial fines, legal liability, and reputation damage, making this metric critical for risk management. Many organizations maintain 100% compliance targets for critical requirements while accepting minor deviations in less critical areas.
Internal Quality Standards
Call calibration scores measure consistency across different quality assurance evaluators. When multiple evaluators score identical interactions, their scoring alignment indicates evaluation process reliability.
Target calibration agreement rates of 90% or higher ensure that agents receive fair, consistent evaluations regardless of which evaluator reviews their performance. Regular calibration sessions maintain scoring consistency as teams evolve and standards update.
Customer callback rate tracks how frequently customers must reinitiate contact for the same issue, serving as an inverse indicator of first call resolution. High callback rates suggest incomplete solutions, inadequate follow-through, or systemic process failures requiring investigation.
Technology and Self-Service Metrics
Self-service containment rate measures the percentage of customer issues resolved through automated systems without agent assistance. Effective self-service reduces operational costs while providing customers with convenient, immediate solutions for straightforward issues.
Containment rates vary significantly based on self-service sophistication and issue complexity. Leading organizations achieve containment rates between 30-60% for appropriate issue types, freeing agents to focus on complex problems requiring human expertise.
Improving self-service containment requires:
- Comprehensive knowledge base content addressing common issues
- Intuitive navigation and search functionality
- Regular content updates based on trending contact drivers
- Seamless escalation to live agents when needed
- Continuous optimization based on usage analytics
Knowledge base effectiveness measures how frequently self-service resources successfully resolve customer issues. This customer service performance metric examines both usage rates and resolution rates, identifying content gaps and improvement opportunities.
System availability and uptime track technology reliability, which directly impacts agent productivity and customer experience. When critical systems experience outages, agents cannot access customer information, processing tools, or knowledge resources necessary for effective service delivery. Maintaining system availability above 99.9% ensures consistent operational capacity while minimizing disruption-related customer frustration. BPO experience demonstrates that robust technology infrastructure forms the foundation for sustainable performance excellence.
Implementing comprehensive customer service performance metrics transforms support operations from reactive firefighting into strategic business assets. Focus Services combines proven measurement frameworks with global delivery expertise to help organizations optimize contact center performance across all critical dimensions. Ready to elevate your customer service operations with data-driven insights and scalable BPO solutions? Partner with Focus Services to build a metrics-based approach that drives measurable improvements in customer satisfaction, operational efficiency, and business outcomes.